
Debugging Alteryx Analytic Apps
Analytic Apps in Alteryx are such a powerful tool to understand and use. They can be used in two different ways. One way is hosted on an Alteryx Server with a web-based user interface which allows non-Alteryx users to run the workflow. Another way is from Alteryx Designer, they can be run on the desktop without delving inside the workflow.
This post isn’t focused on what an Analytic App is or how to build them. If you want to know more about creating Analytic Apps then check this set of interactive lessons on Alteryx Community.
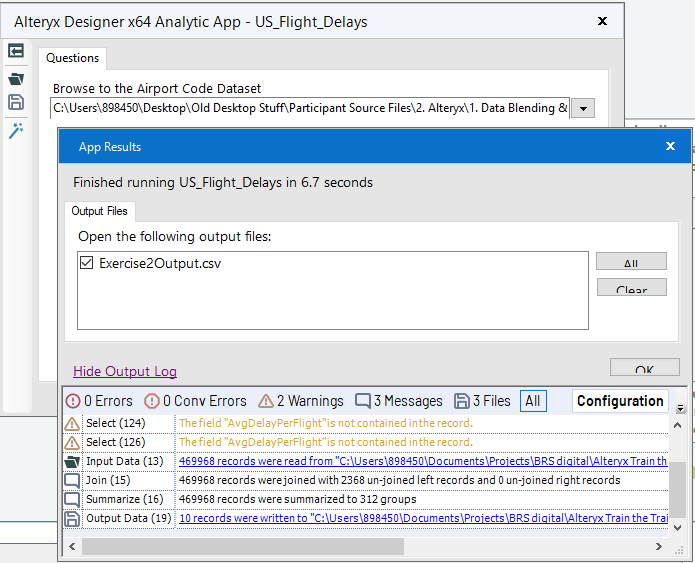
We use Analytic Apps a lot! They are a way of easily running a workflow on a new dataset without fiddling around to point the input tools at the new datasource. However, as we recently found out, one downside of running an app is you don’t get the benefit of running the workflow directly inside Designer. You don’t get to see what happens to the flow of your data (which is one of the reasons we love Alteryx). For example, in Designer it is clear how many records are passing through each tool.

However, when you run it as an analytic app it becomes a bit of a black box. You could look in the results window, which has valuable information. However, you don’t get to see your data at each anchor like you would in Designer. So if something unexpected starts happening to your workflow it can tricky to workout why.
Debugging mode to the rescue
I should probably admit now. When Interface Designer window is loaded this big button called ‘Open Debug’, it took me almost two years of using Alteryx to press(!). While it is now obvious from the name it was only after a couple of hours of thinking ‘the workflow runs fine in Designer, I can’t work out why when it is run as an app that it goes wrong?‘ that I decided to press it once and actually discovered what it does!
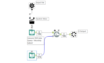
The workflow that I discovered this on is the one below where I have lots of nested text input boxes and detour tools to run an API via different end points depending on the user’s inputs. 
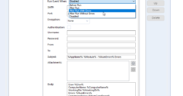
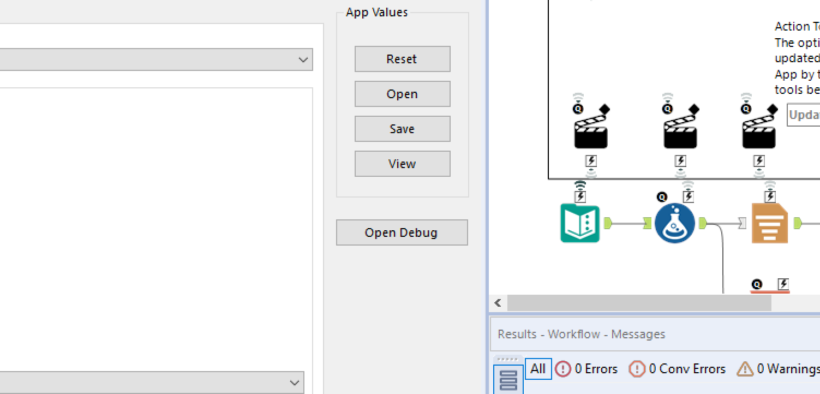
I was finding that I could run the workflow in Designer fine, and I would manually update the direction of the detour tools to run each branch of the workflow and hence check each API call was working correctly. Yet when I tried to do the same in the App Interface I was getting errors as the API calls were not being correctly formed, which is when I turned to Debug mode. Debug mode is activated in the Interface Designer. First press on the magic wand icon to load up this screen (below) and then complete the Analytic App with the data you want, then click on the ‘Open Debug’ button to the right.
This then opens up a new workflow with the settings from the App detailed at the top of the workflow.
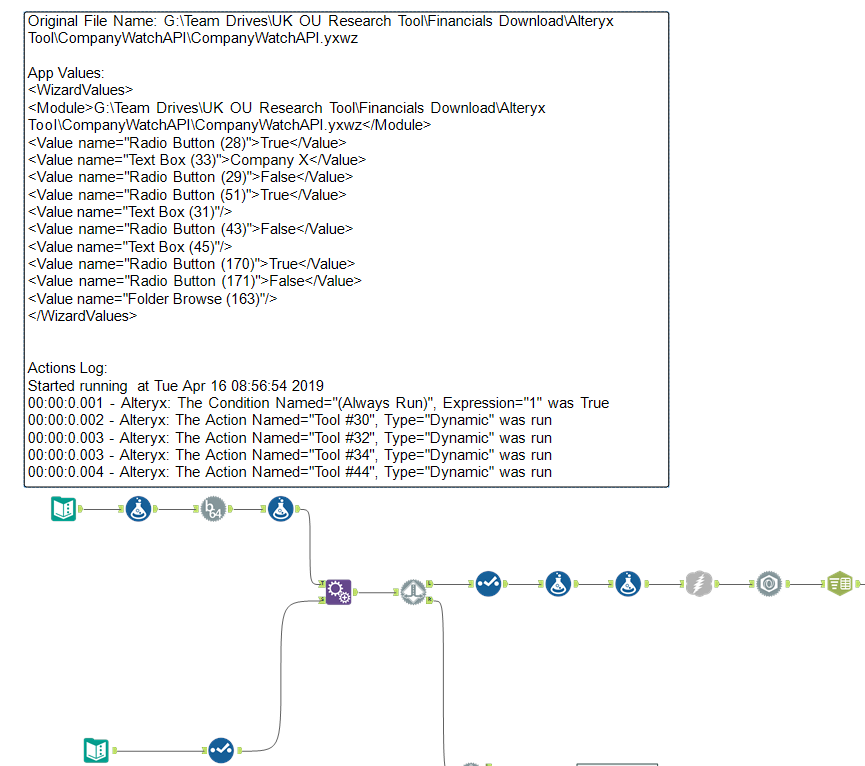
You can now run the workflow and see the data running through the workflow to help understand where the Analytic App is (or in my case not) updating a specific value and flowing through the workflow.

As you can see Company X is now passed into the workflow in the q field which was what I selected in the Analytic App so i know it is working as expected and can now save myself many headaches in the future!!!